8.12 EMP_barplot
A bar plot is a statistical chart used to visualize the distribution of data.
8.1.1 Bar Plot for Abundance Data
🏷️Example:
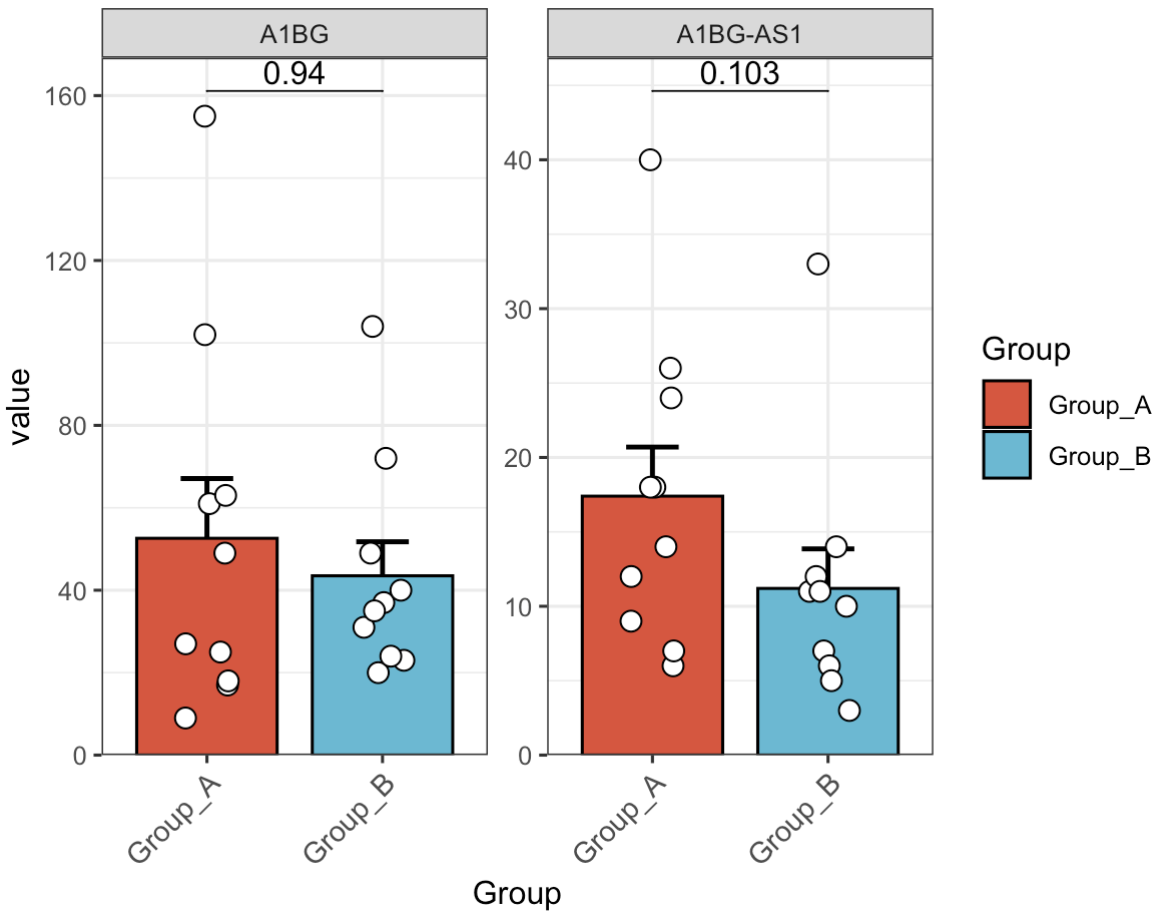
MAE |>
  EMP_assay_extract('host_gene',pattern = 'A1BG',pattern_ref = 'feature') |>
  EMP_barplot(method='t.test',estimate_group='Group')
8.1.2 Display Only Upper Error Bars
🏷️Example:
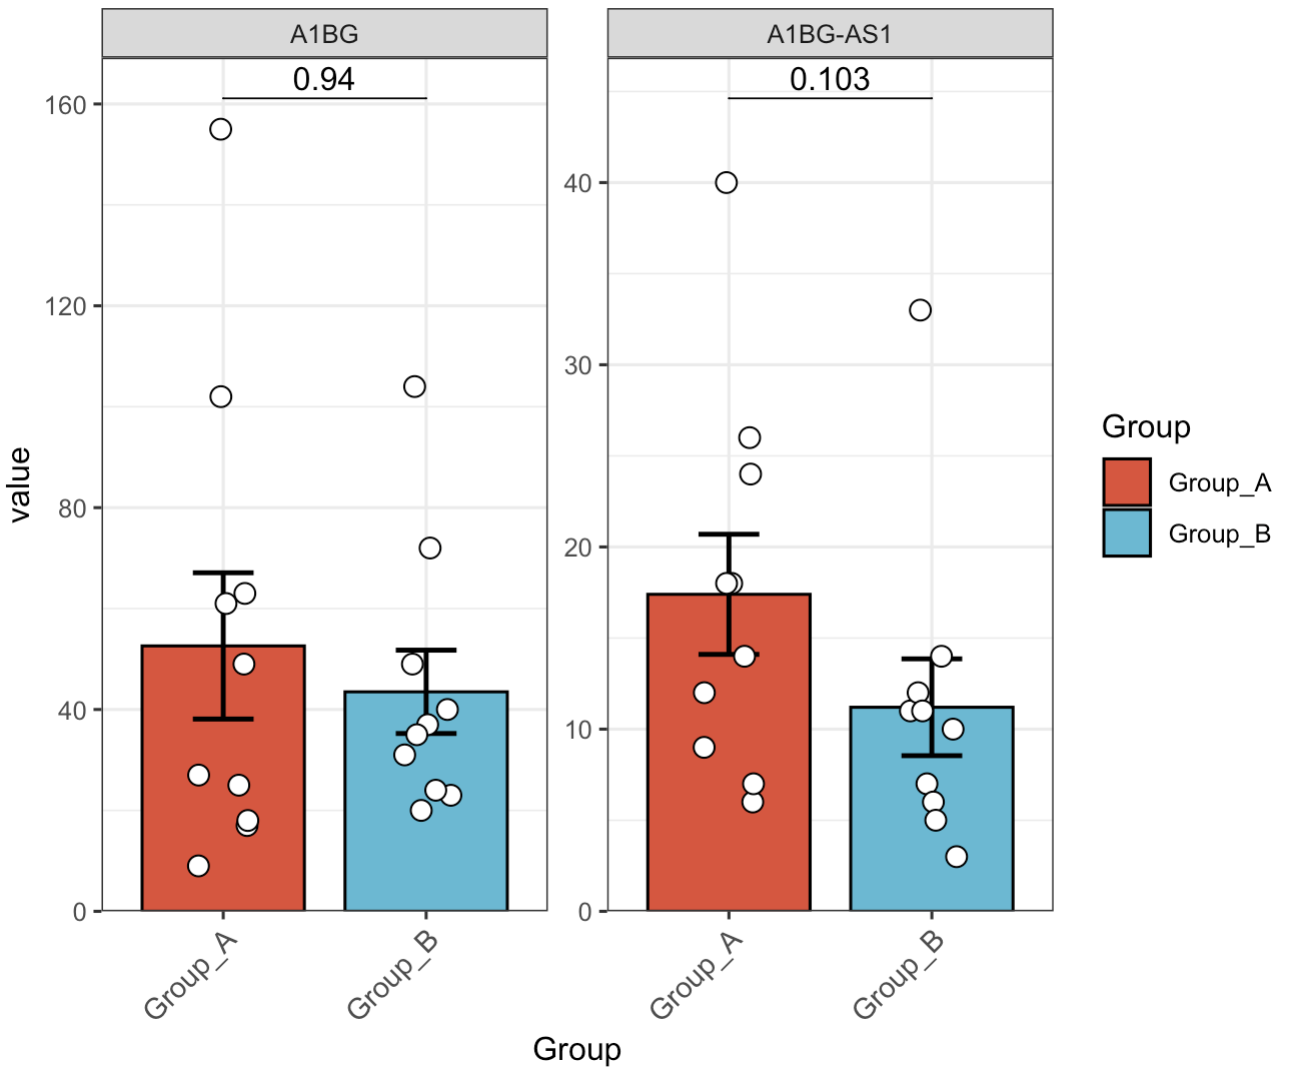
MAE |>
  EMP_assay_extract('host_gene',pattern = 'A1BG') |>
  EMP_barplot(estimate_group = 'Group',error_bar = 'upper')
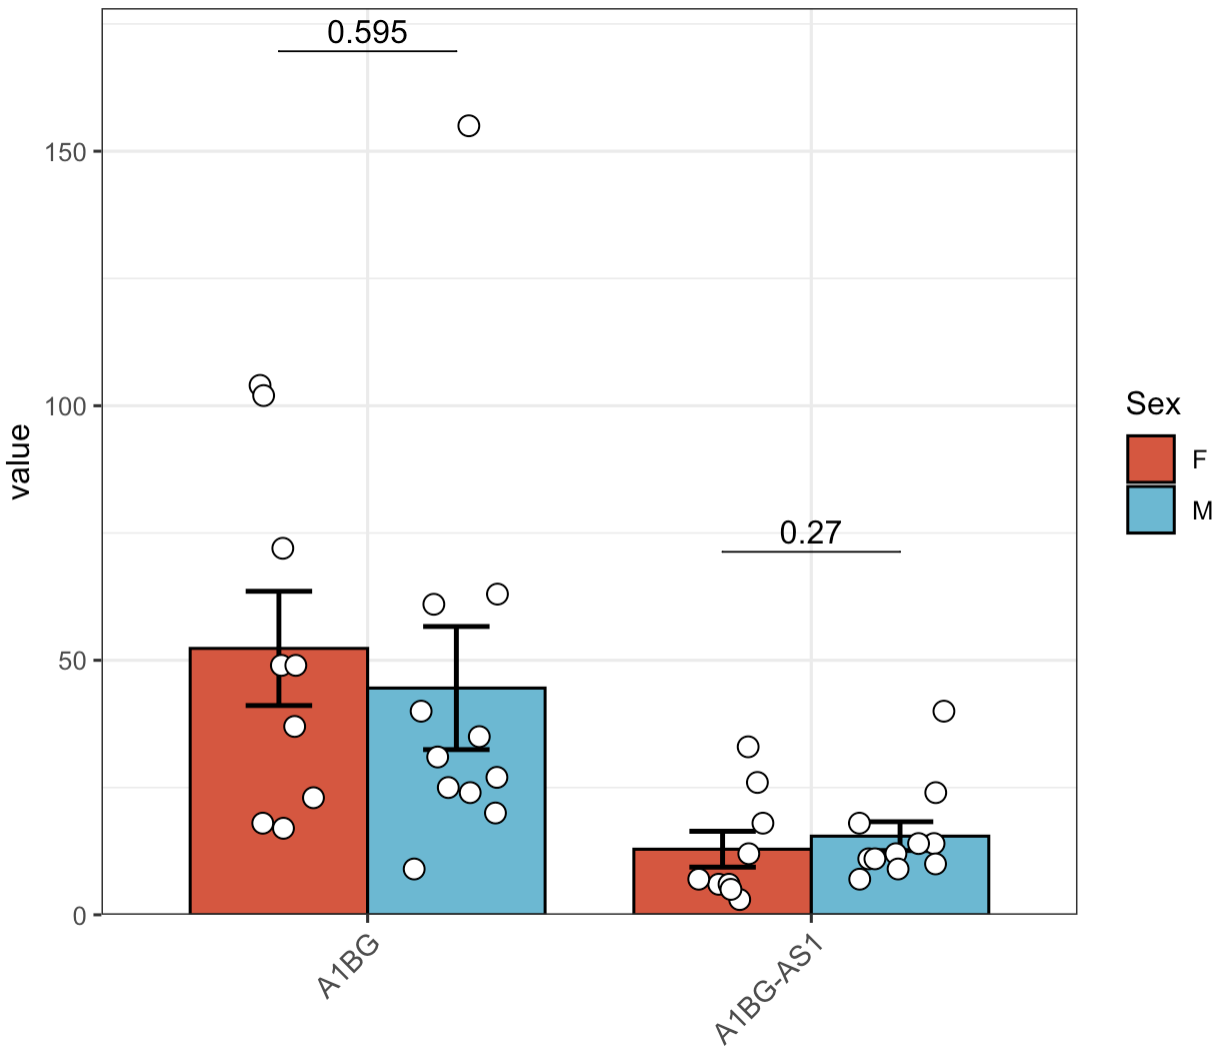
8.1.3 Subgroup Analysis
🏷️Example:
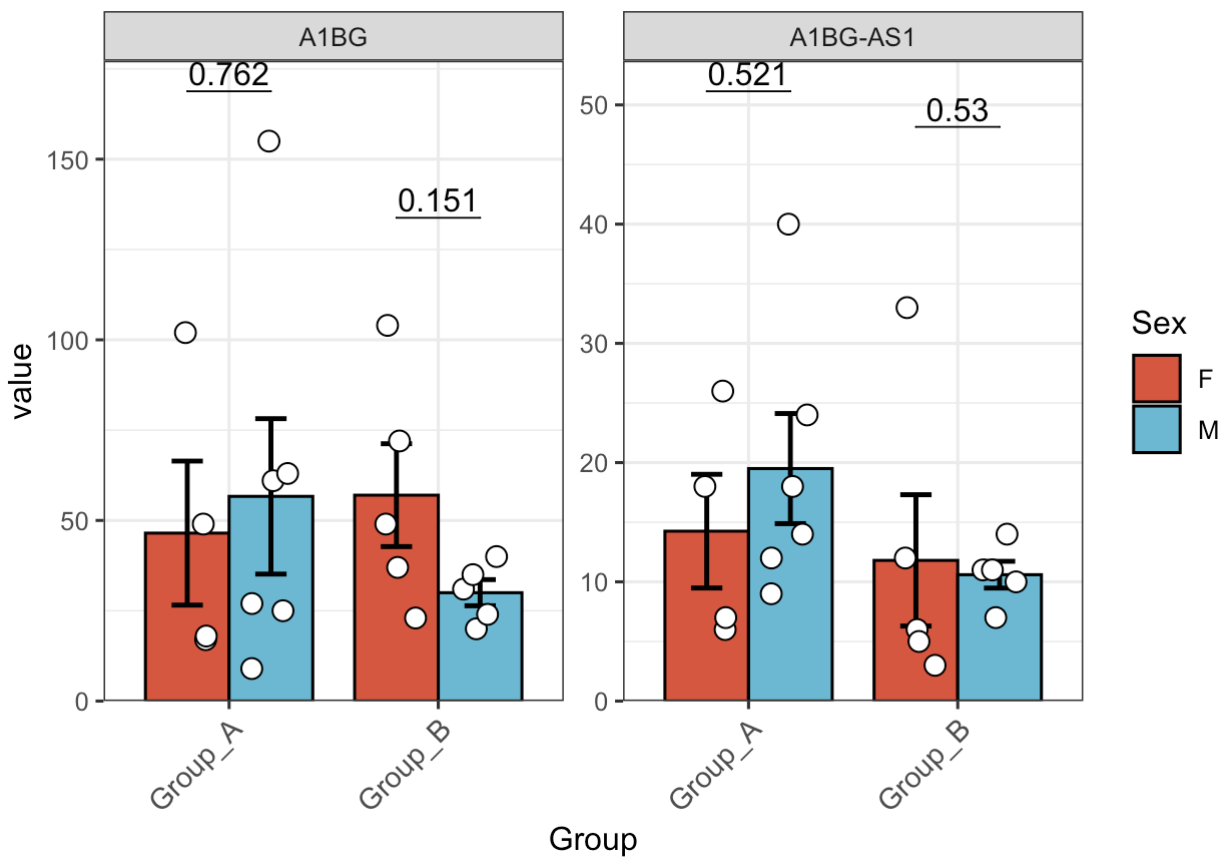
MAE |>
  EMP_assay_extract('host_gene',pattern = 'A1BG') |>
  EMP_barplot(estimate_group = 'Group',compare_group='Sex')
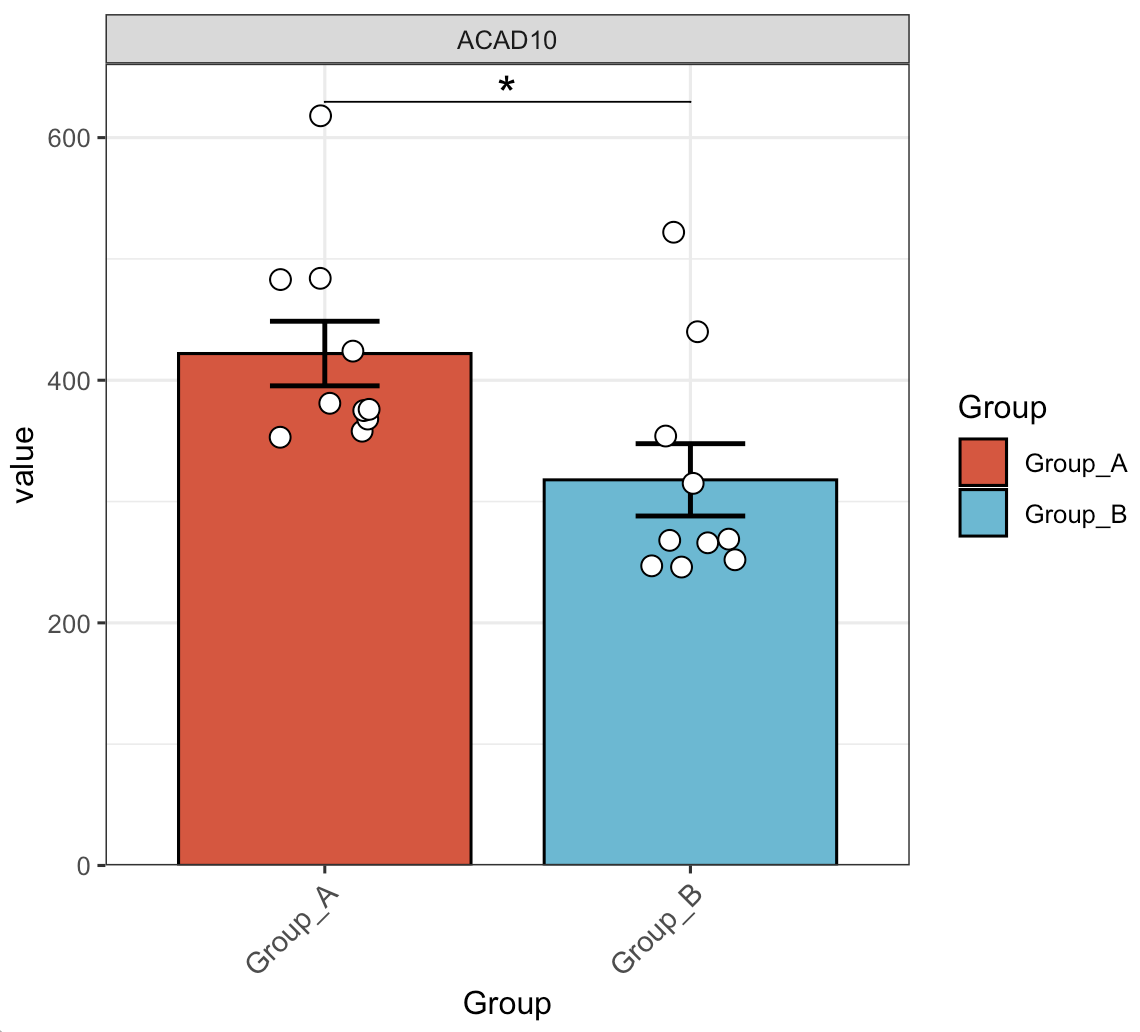
8.1.4 Adjusting Statistical Significance Display
🏷️Example:
MAE |>
  EMP_assay_extract('host_gene',pattern = 'ACAD10') |>
  EMP_barplot(estimate_group = 'Group',label = 'p.signif',label.size=6)
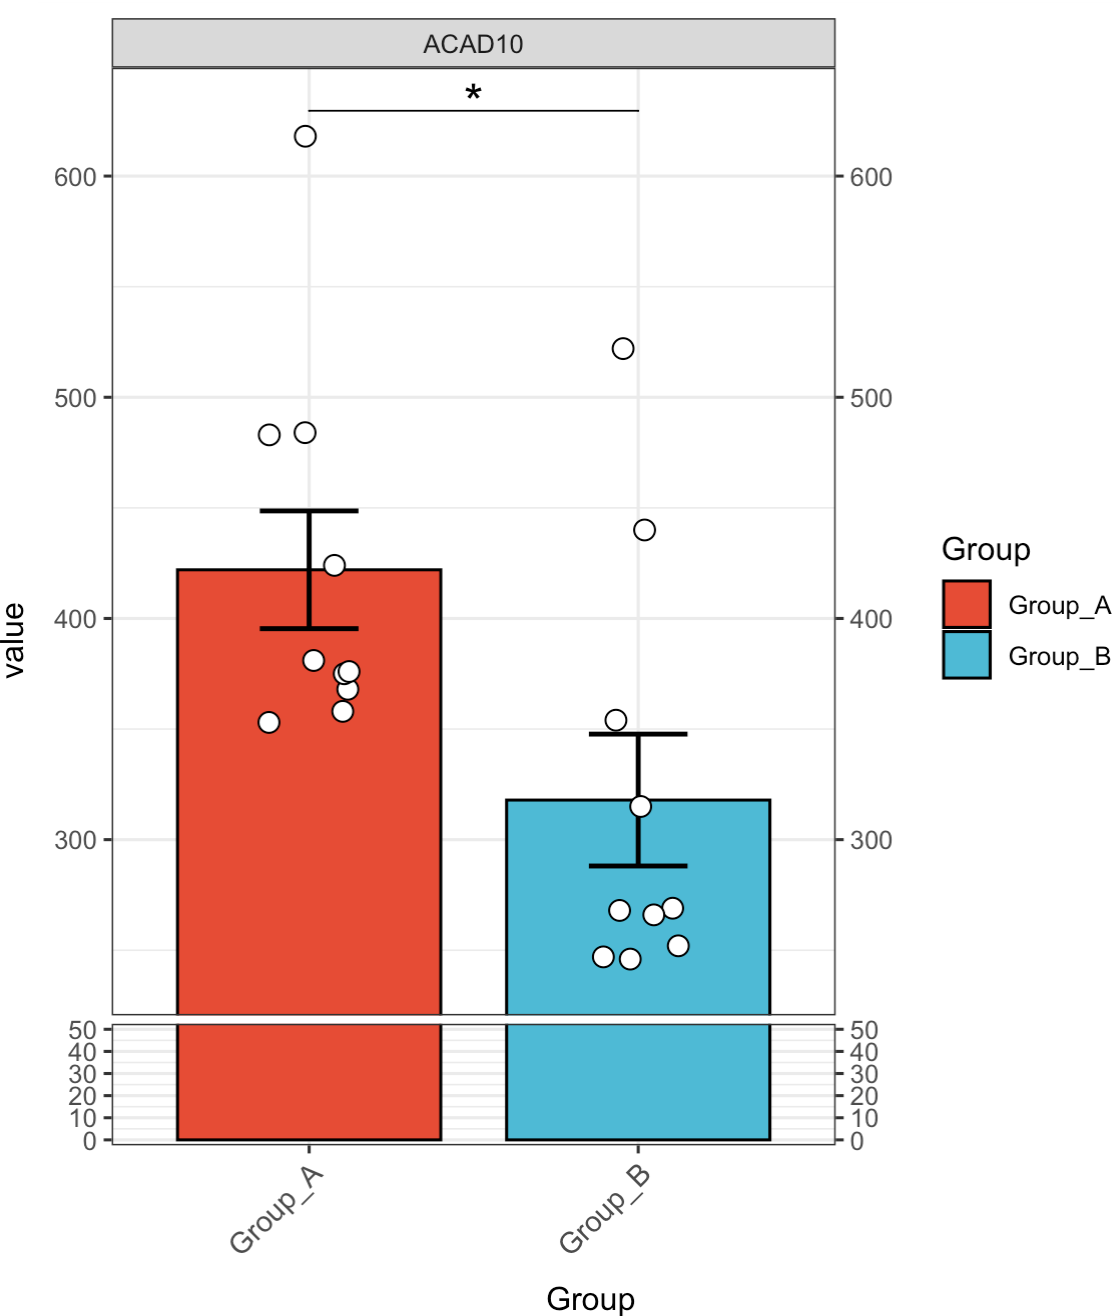
8.1.5 Break the Y axis
🏷️Example:
MAE |>
  EMP_assay_extract('host_gene',pattern = 'ACAD10') |>
  EMP_barplot(estimate_group = 'Group',label = 'p.signif',
              label.size=6,y_break = c(50,240))
8.1.6 Combining Multiple Features
🏷️Example:
MAE |>
  EMP_assay_extract('host_gene',pattern = 'A1BG') |>
  EMP_barplot(estimate_group = 'Group',compare_group='Sex',facet = FALSE)
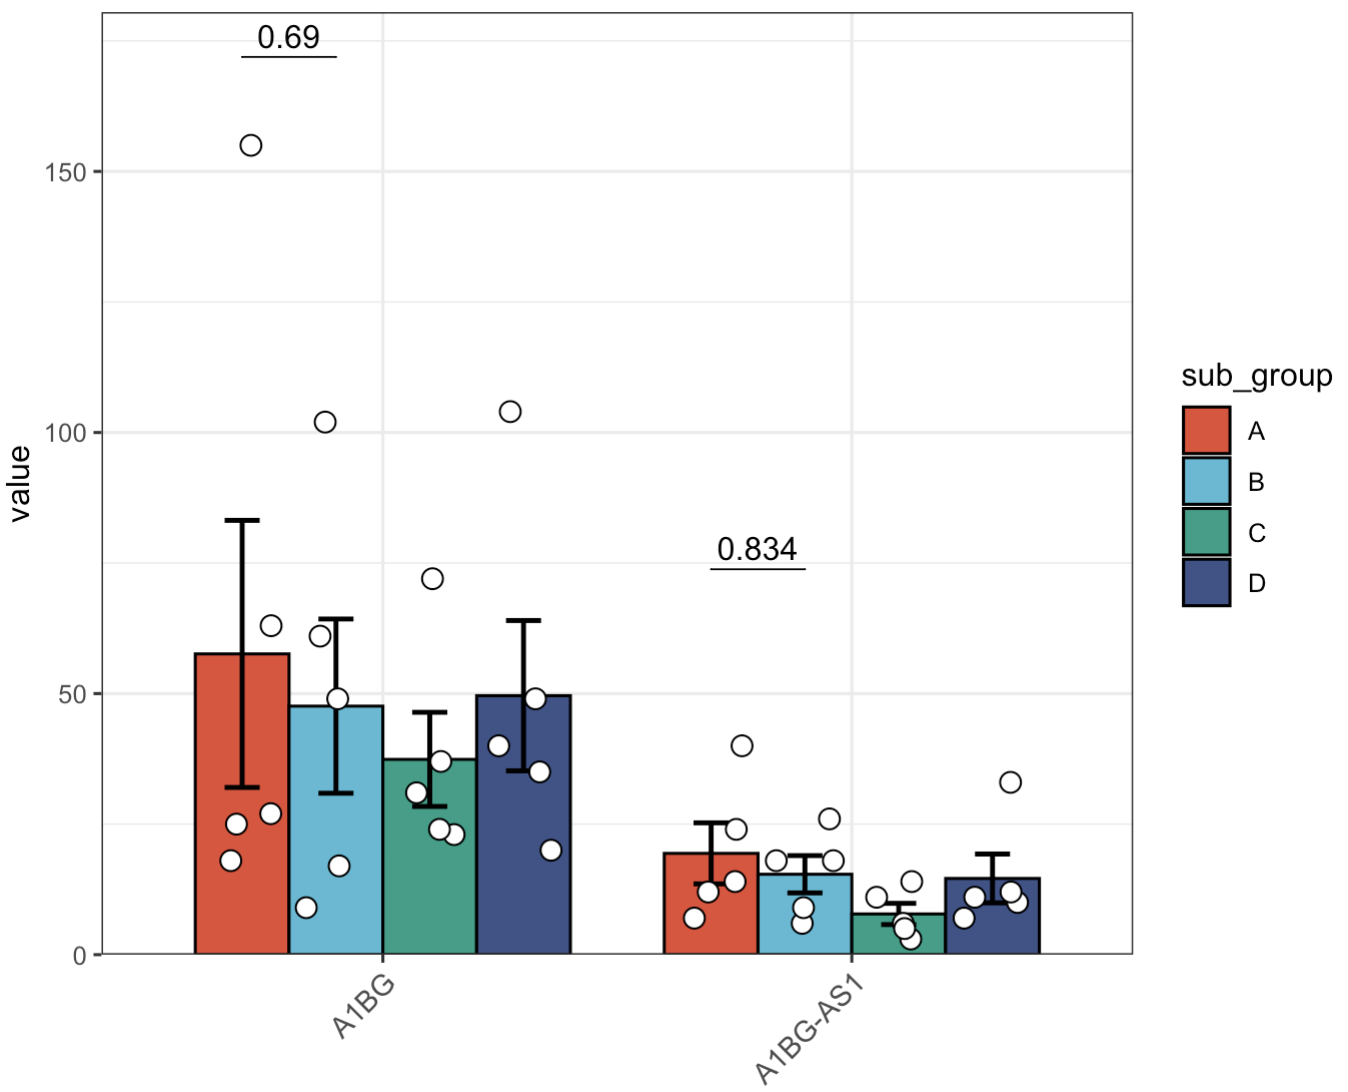
8.1.7 Modifying Comparison Groups
🏷️Example1:Comparing all groups to Group A only
MAE |>
  EMP_assay_extract('host_gene',pattern = 'A1BG') |>
  EMP_barplot(estimate_group = 'Group',compare_group='sub_group',
              ref.group = 'A',
              facet = FALSE)
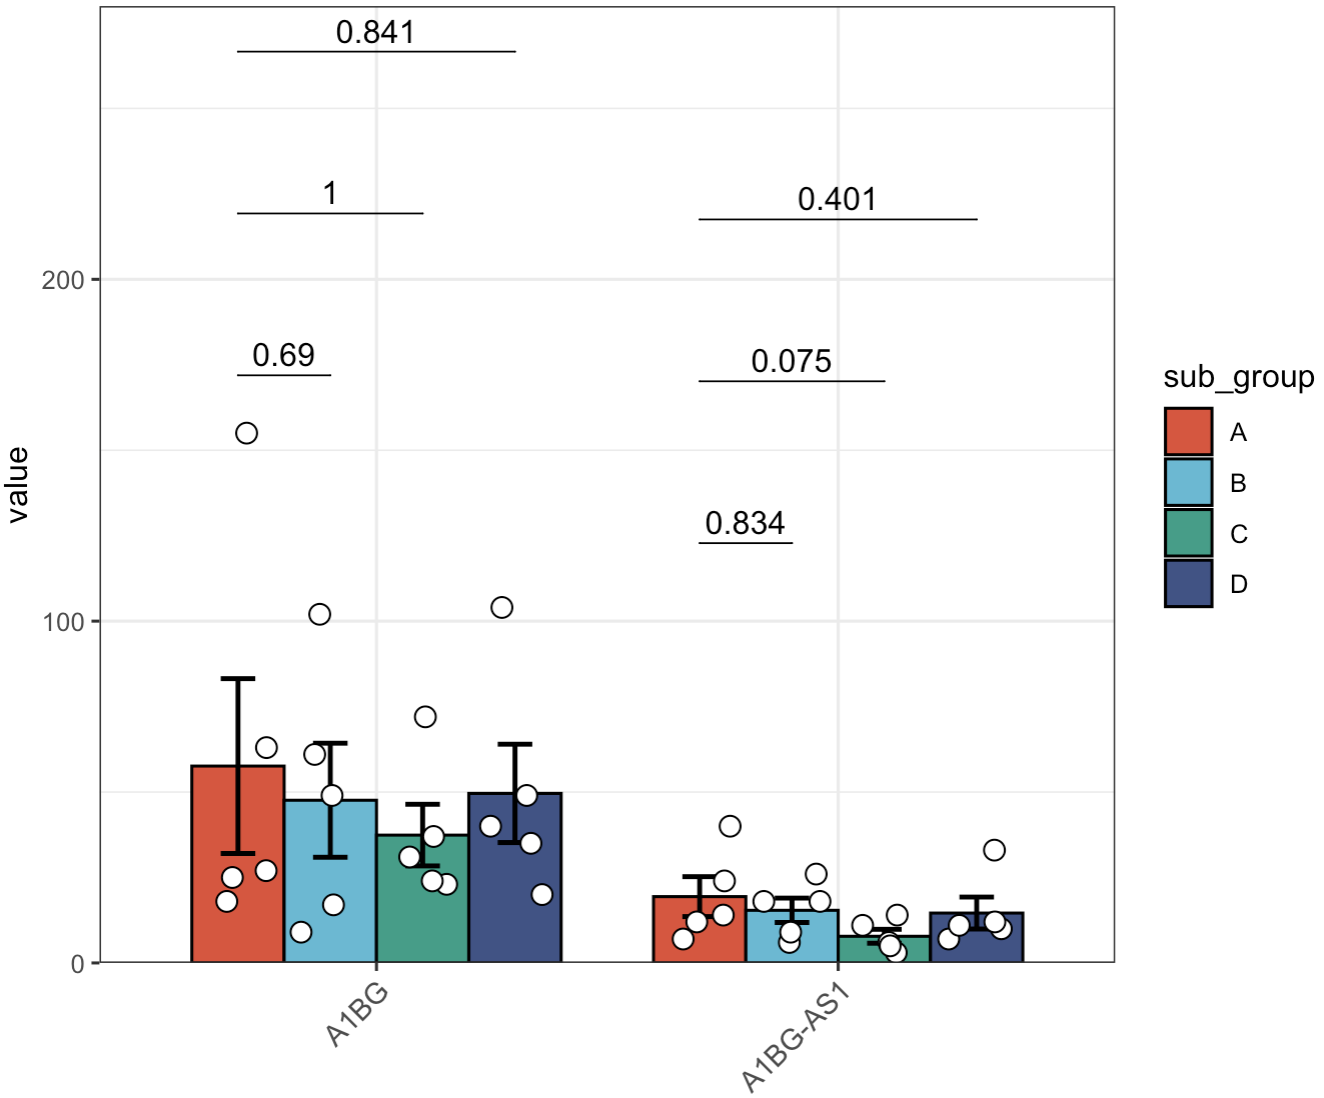
🏷️Example2:Comparing only Groups A and B
MAE |>
  EMP_assay_extract('host_gene',pattern = 'A1BG') |>
  EMP_barplot(estimate_group = 'Group',compare_group='sub_group',
              comparisons = list(c('A','B')),
              facet = FALSE)
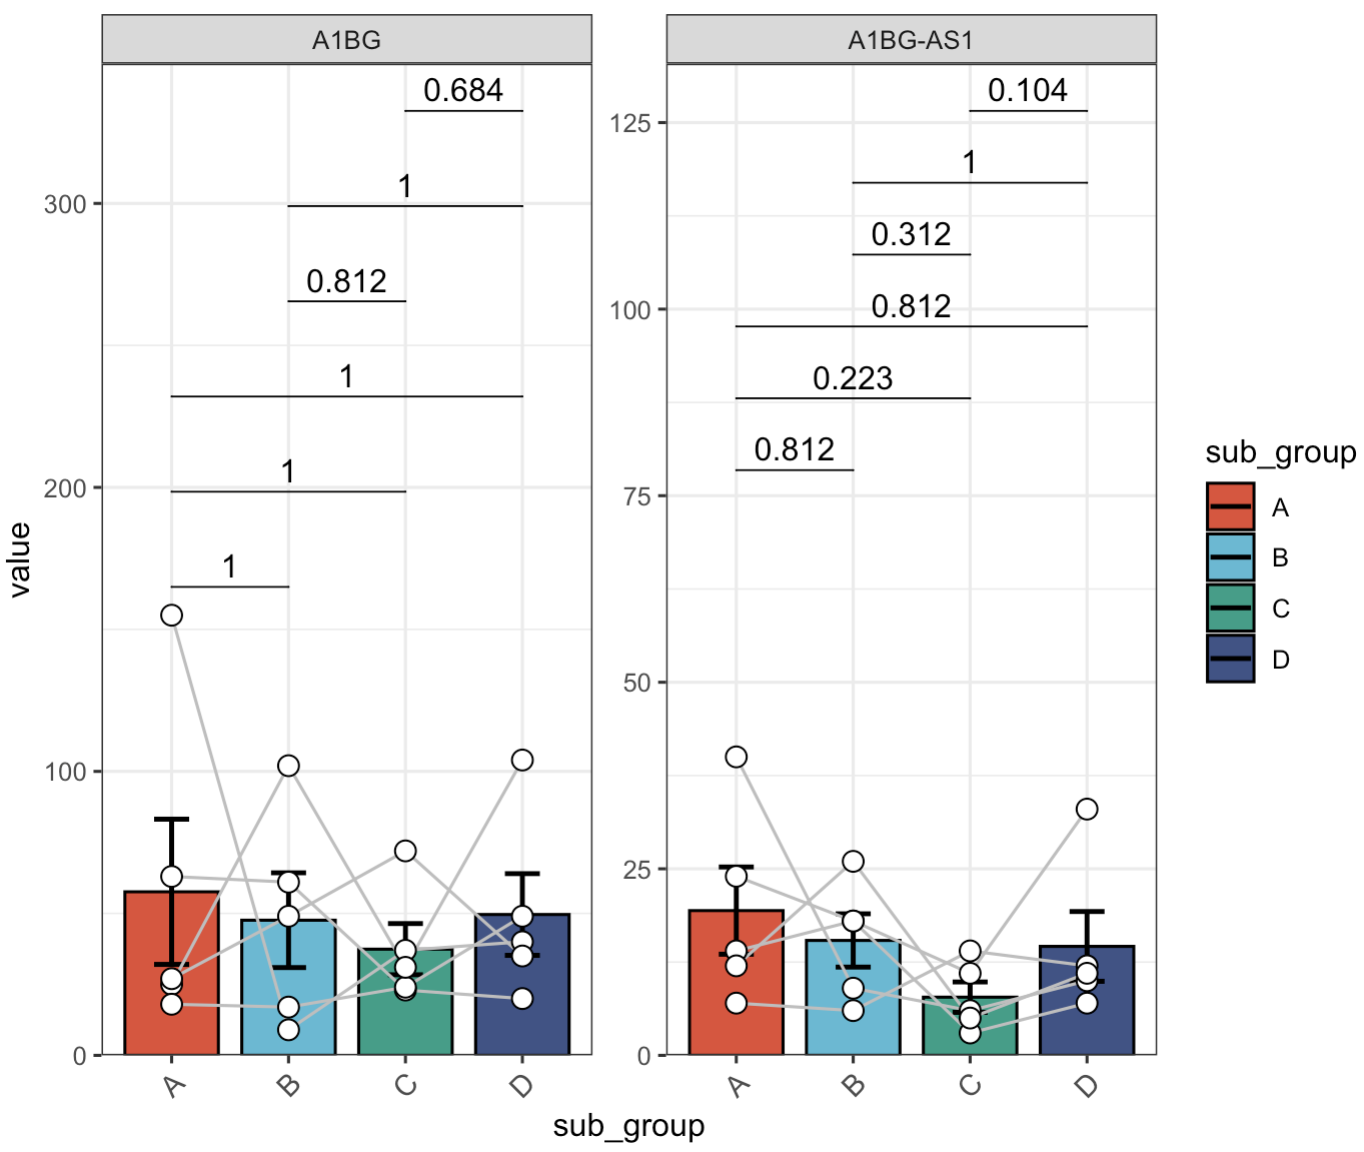
8.1.8 Paired Tests
🏷️Example:
MAE |>
  EMP_assay_extract('host_gene',pattern = 'A1BG') |>
  EMP_barplot(estimate_group = 'sub_group',
              paired_group = 'patient')
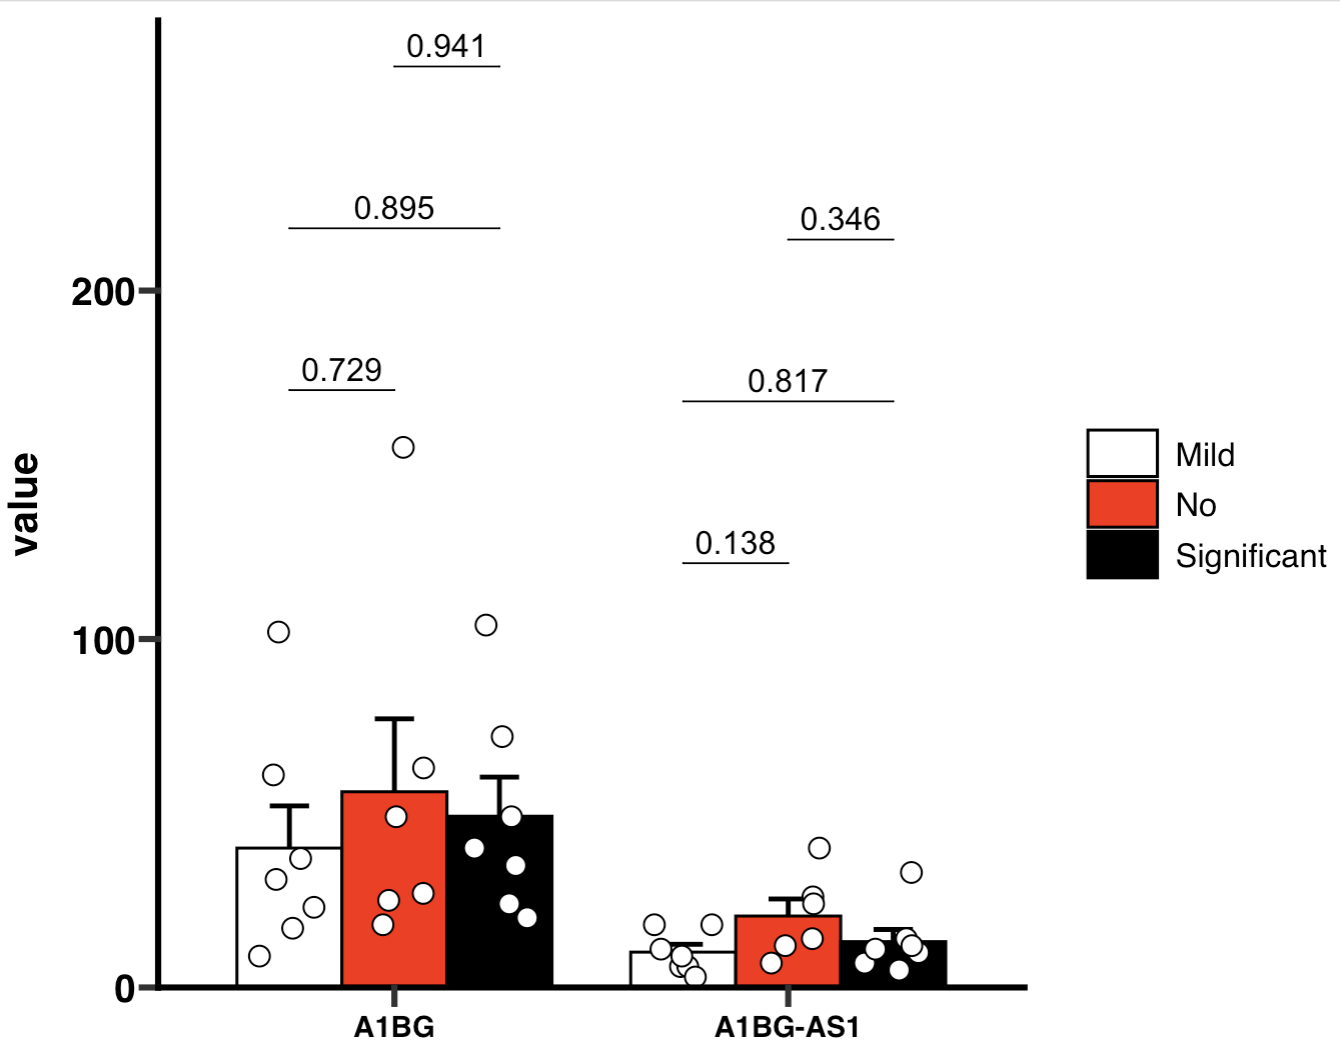
8.1.9 Creating GraphPad-Style Plots
🏷️Example1:
Loading the style package:
if (!requireNamespace("ggprism", quietly=TRUE)) install.packages("ggprism")
library(ggprism)
GraphPad uses Tukey's test for multiple group comparisons.
MAE |>
  EMP_assay_extract('host_gene',pattern = 'A1BG') |>
  EMP_barplot(estimate_group = 'Group',compare_group='Status',
              palette = c('white','red','black'),error_bar = 'upper',
              method = 'tukey.hsd',facet = FALSE,
              mytheme ='theme_prism()')
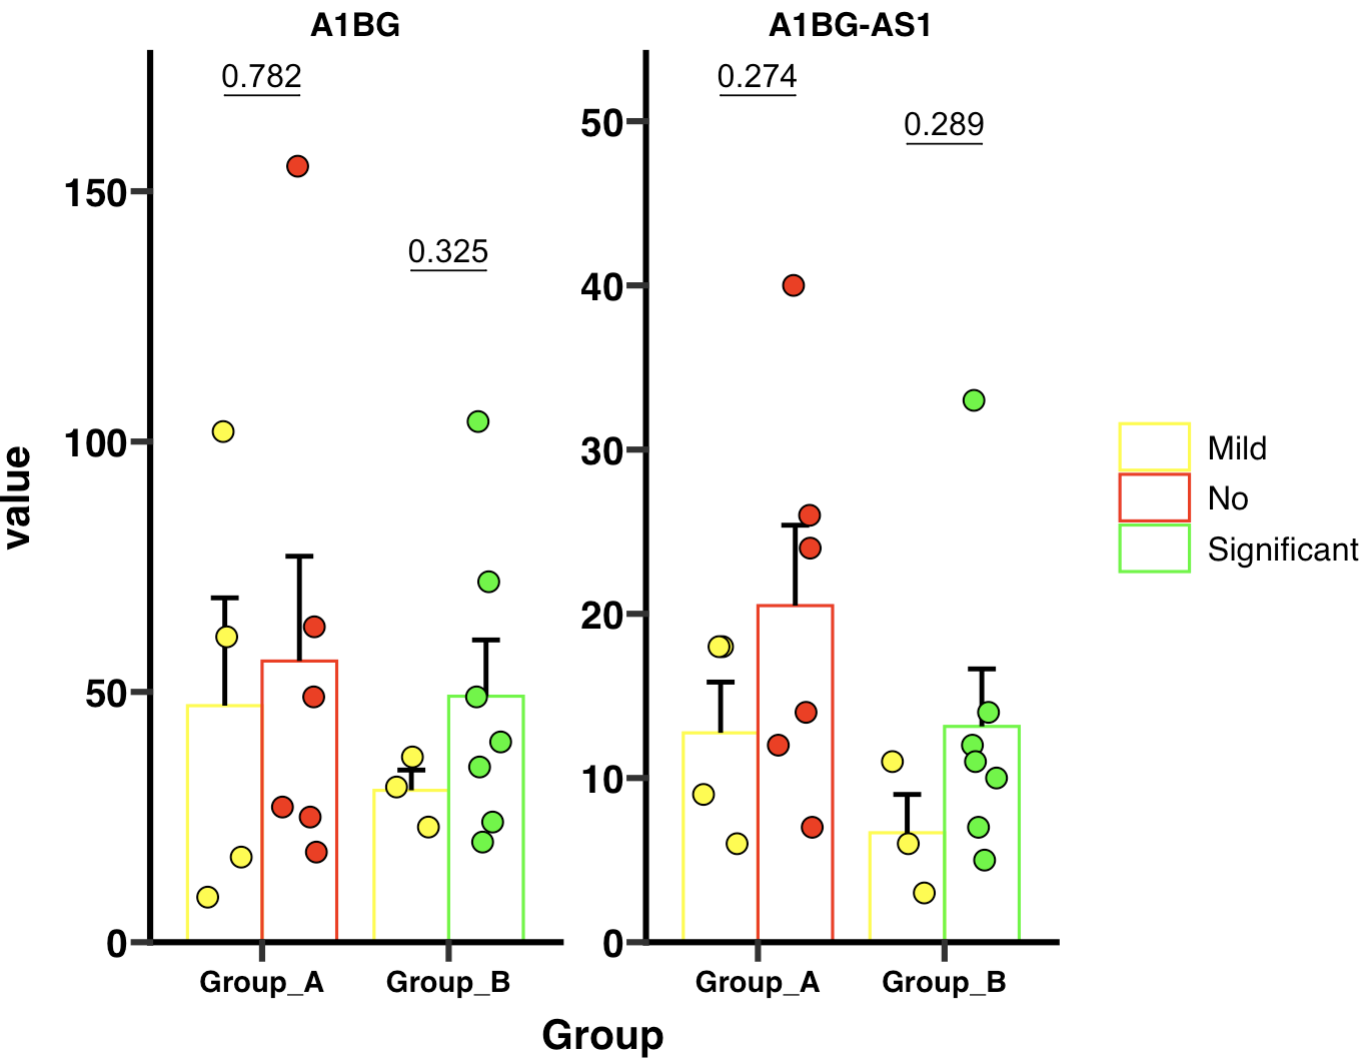
🏷️Example2:
MAE |>
  EMP_assay_extract('host_gene',pattern = 'A1BG') |>
  EMP_barplot(estimate_group = 'Group',compare_group='Status',
              bar_alpha = 0,bar_color = 'group',
              palette = c('yellow','red','green'),error_bar = 'upper',
              method = 'tukey.hsd',dot_color = 'group',
              mytheme ='theme_prism()')